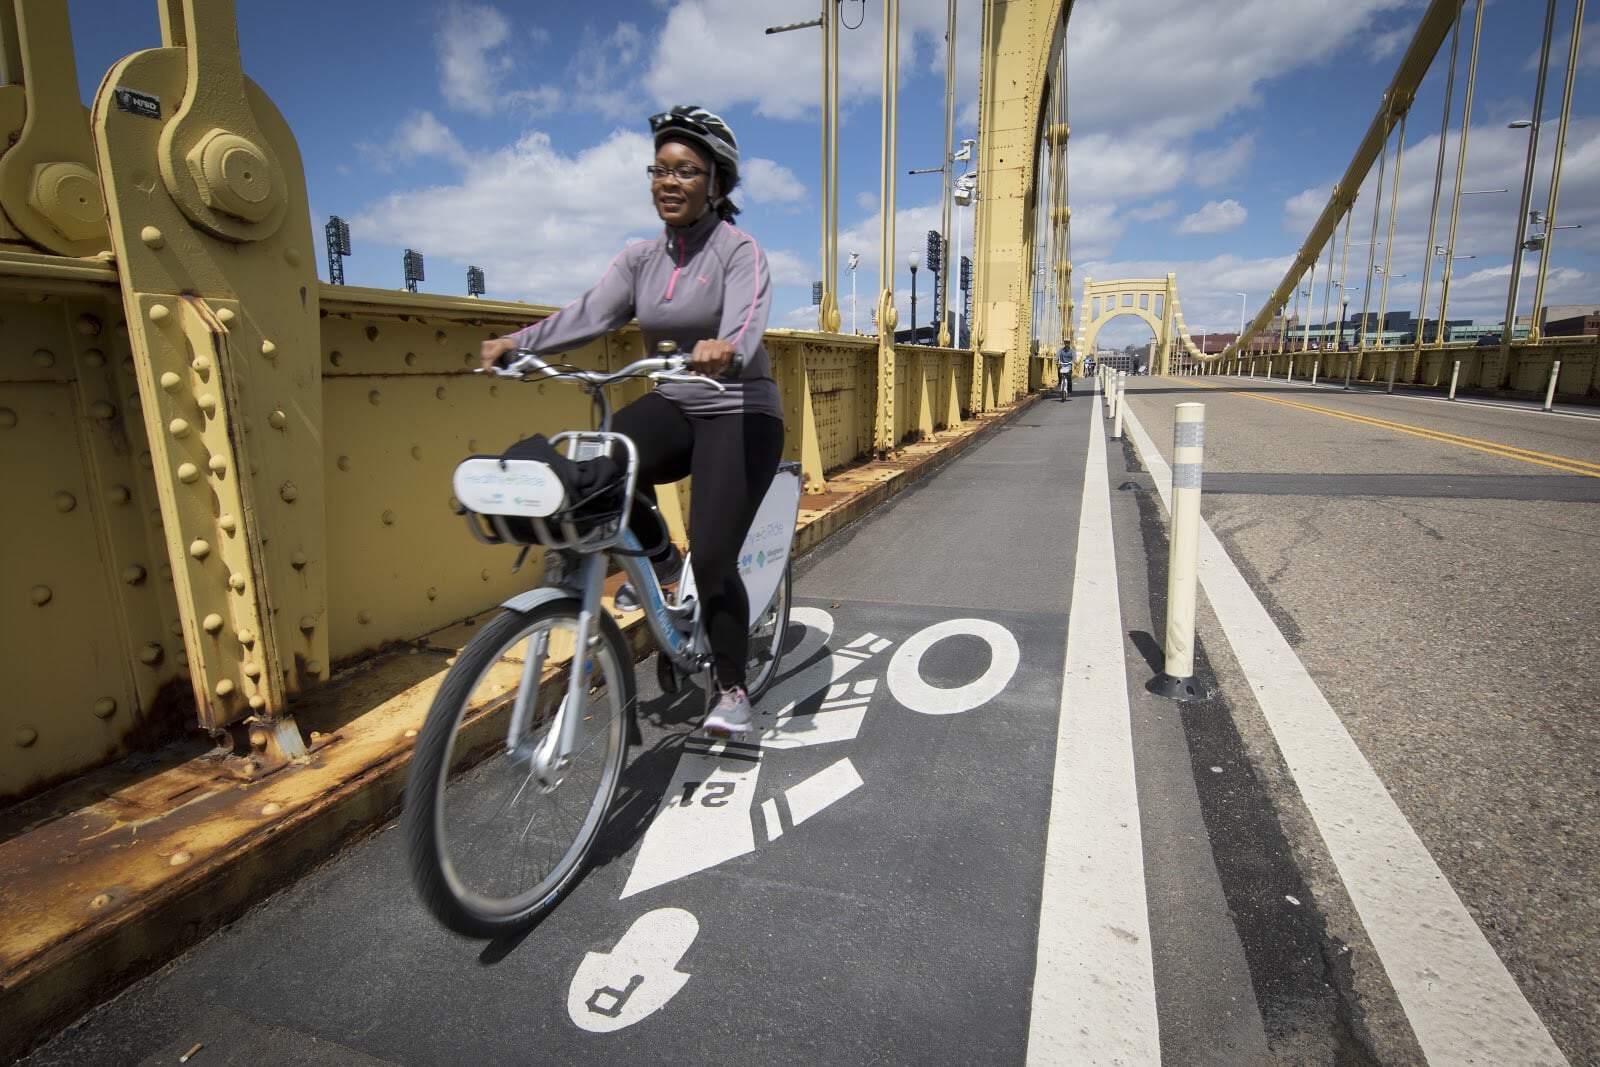
 Healthy Ride’s Bike Share and protected bike lanes are among the newest ways of improving transportation choices
Annual Census stats help us understand how Pittsburgh compares to the 60 largest US Cities
Every September, the US Census posts their American Community Survey (ACS) transportation stats for the previous year. This annual snapshot helps us see where we’re going, where we’ve been, while trying to understand some of the underlying trends, both locally and nationally.
For instance, some things that we’ve noticed from looking into this data:
- Pittsburgh’s bike commute share has doubled since 2007, when the City began installing bike lanes
- We have some of the highest walking rates in the country
- We are in the top-10 cities with a no car commute
- Our public transit share has unfortunately decreased, seemingly tied to funding issues
- There are a lot of Pittsburghers who have no access to a car
This is now our tenth year reporting on the data for the 60 largest US cities (2006) (2007) (2008) (2009) (2010) (2011) (2012) (2013) (2014). As the ACS has some flaws, these numbers should not be taken at face value (see below).
Affordable housing + Affordable Transportation
This year, due to a rapidly changing Pittsburgh, there is a renewed focus on affordable housing. An important part of affordable housing is also affordable and convenient transportation. Rising home and rent prices have driven some people out of neighborhoods that they’ve lived in for a long time. If an inexpensive house is located in a place that you need to own a car, then it is no longer affordable.
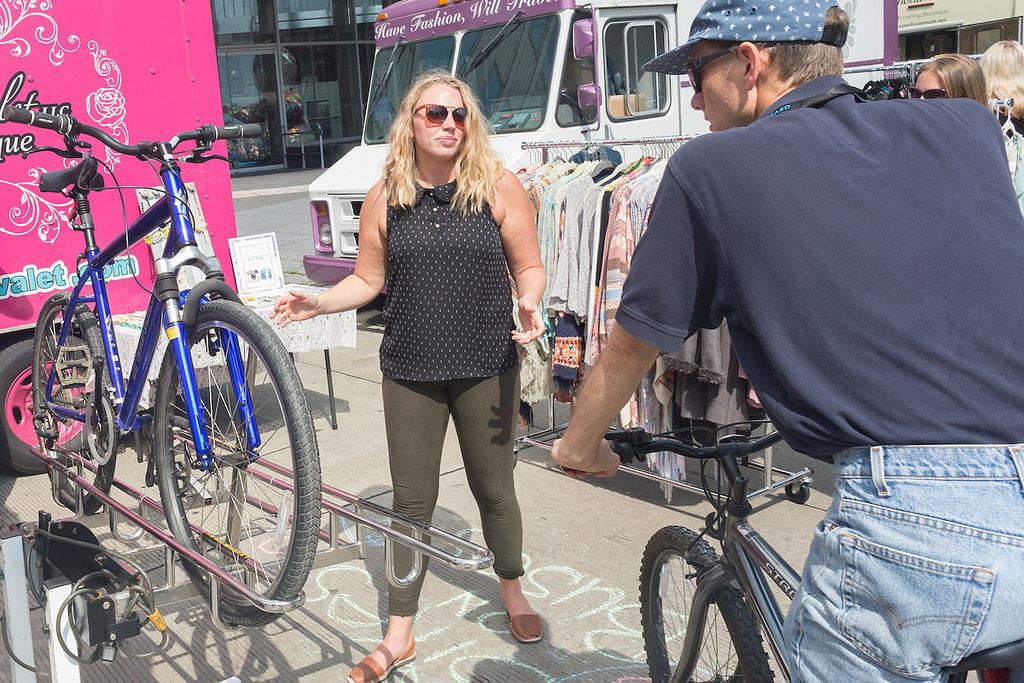
Initiatives like the Port Authority’s bike racks on buses program help reduce car dependency
The ACS tracks a lot of things, and one thing that it tracks, that we’ve never reported on, is the number of households in a city with no access to a car. Not surprisingly, cities where households have less access to a car, also see higher rates of biking, walking, and transit.
What was surprising (at least to us) was the large number of households in Pittsburgh that have no access to a vehicle. The ACS reveals that approximately a 25% of Pittsburgh households claim no access to a car, as well as approximately 13% of Pittsburgh workers, placing us 8th in the country (out of largest 60 cities) in this metric. According to the Department of Housing and Urban Development’s Guidebook for Creating Connected Communities, typical households in auto-dependent neighborhoods spend about 25 percent of their income on transportation costs, but this number drops to 9 percent in neighborhoods that are more connected with a variety of mobility options.
Combined with a decrease in affordable housing stock, these figures make it clear that affordable housing and affordable transportation choices must go hand in hand.
What is the American Community Survey?
The American Community Survey is the country’s largest household survey, reporting its findings every year. With a sample size of about 3 million addresses, this is only an estimate, but is by far the best tool that we have understanding trends in the United States. The survey uses questionnaires and interviews to gather information on demographic, economic, and housing characteristics.
ACS limitations, notes, and cautions
- The ACS asks only about commuting. It does not tell us about bicycling for non-work purposes.
- Results are based on a survey of a sample of the population. Surveys take place throughout the year. The journey to work question asks respondents about the previous week.
- The journey to work question asks about the primary mode of transportation to work. The wording of the question undercounts the actual amount of bike commuting that occurs. It does not count people who rode once or twice a week or people who bike to transit (if the transit leg is longer than the bike leg).
- Since the ACS is a survey of a sample, the results are estimates. The ACS releases a margin of error along with the estimate. Users can add and subtract the margin of error value from the estimate to find the top and bottom of the range within which the ACS is 90 percent confident in their estimate lies. Margins of error are reported on with the data on the ACS site.
- Changes among years may not be statistically significant.
- The numbers reported here are for the “principal city,” not the larger Metropolitan Statistical Area (MSA).
3 Comments
[…] Related: See our latest post about Pittsburgh’s commuting stats based on the US Census’ American Community Survey data. […]
[…] aligns with Pittsburgh having the 3rd largest share of walking commuters in the country, out of the 60 largest cities. This ranking does not mean that we don’t have work […]
[…] Pittsburgh ranked 8th in no-car commuting according Census Bureau’s Annual Survey […]