
Where is it most dangerous to be a pedestrian in the United States?
Today, Smart Growth America answered that question with the release of Dangerous by Design 2016, a report on the American epidemic of pedestrian deaths. Now in its seventh year, this edition will include new Pedestrian Danger Index numbers for all 50 states and the District of Columbia. In addition, the analysis will expand their examination of metro areas from 51 to 104 regions around the country.
Where does Pittsburgh rank?
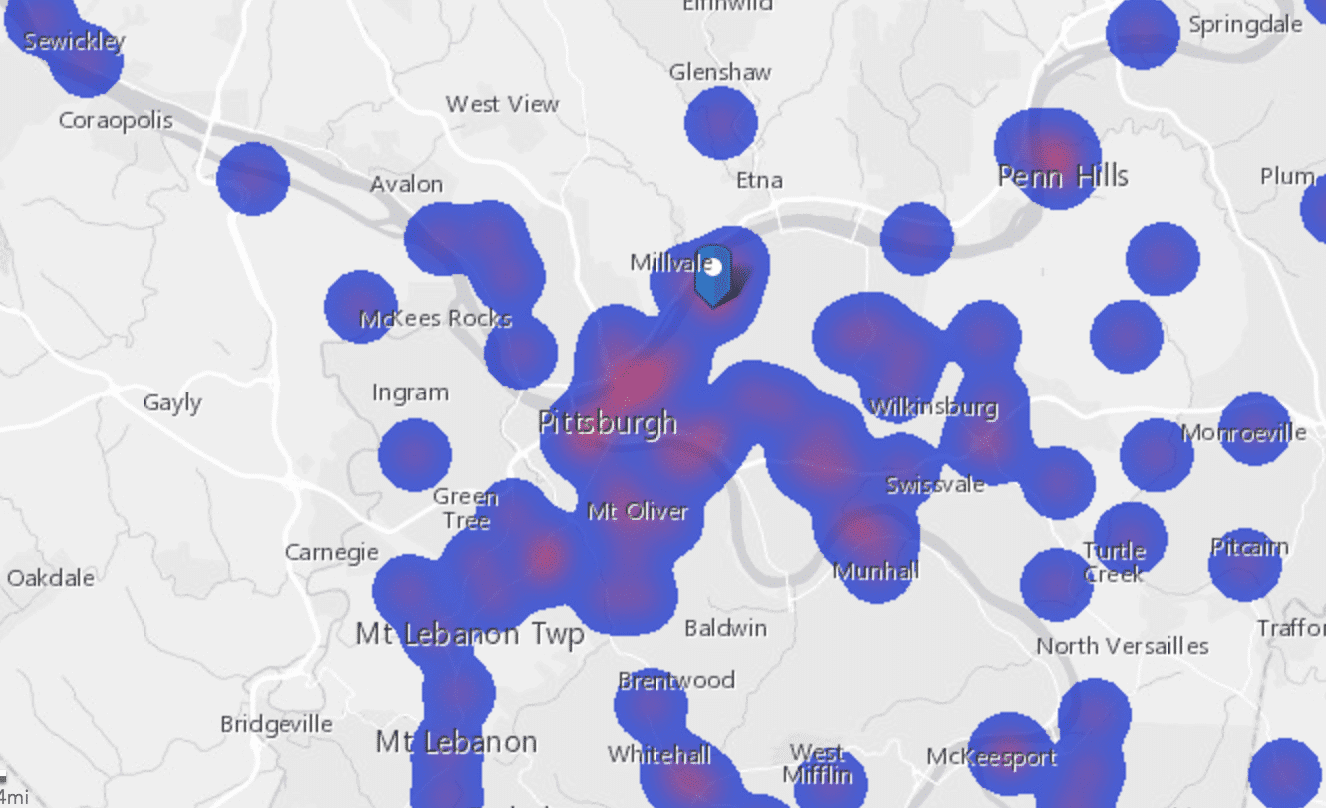
This heat map of pedestrian fatalities visualizes where multiple collisions have occurred in Pittsburgh. Click here to use the interactive map.
Pittsburgh was named the 9th least dangerous metro area in the country for people walking.
This aligns with Pittsburgh having the 3rd largest share of walking commuters in the country, out of the 60 largest cities. This ranking does not mean that we don’t have work to do, rather, it means that the goal of zero traffic deaths is actually achievable in the Steel City.
Where is it most dangerous to be a pedestrian in the United States?
- Cape Coral-Fort Myers, FL
- Palm Bay-Melbourne-Titusville, FL
- Orlando-Kissimmee-Sanford, FL
- Jacksonville, FL
- Deltona-Daytona Beach-Ormond Beach, FL
- Lakeland-Winter Haven, FL
- Tampa-St. Petersburg-Clearwater, FL
- Jackson, MS
- Memphis, TN-MS-AR
- North Port-Sarasota-Bradenton, FL
Where is it the least dangerous to be a pedestrian in the United States?
- Colorado Springs, CO
- Portland-South Portland, ME
- Madison, WI
- Boston-Cambridge-Newton, MA-NH
- Provo-Orem, UT
- Syracuse, NY
- Lancaster, PA
- Seattle-Tacoma-Bellevue, WA
- Pittsburgh, PA
- New York-Newark-Jersey City, NY-NJ-PA

Where are the most dangerous streets near you? This map plots every pedestrian fatality from 2005-2014. Click here to use the interactive map.
BikePGH report on Pedestrian and Bicycling Safety
BikePGH recently published a detailed Report on Pedestrian and Bicycling Safety in Pittsburgh. This report found that pedestrians and bicyclists are killed at a higher rate than auto drivers, and account for a large share of all fatal crashes in Pittsburgh. While only 6% of all traffic crashes involved pedestrians, they accounted for a stunning 26% of Pittsburgh’s traffic fatalities from 2011-2015.Zero is the only acceptable number of traffic deaths, and investing in pedestrian infrastructure will have a large effect on improving road safety for all.
Crash Stats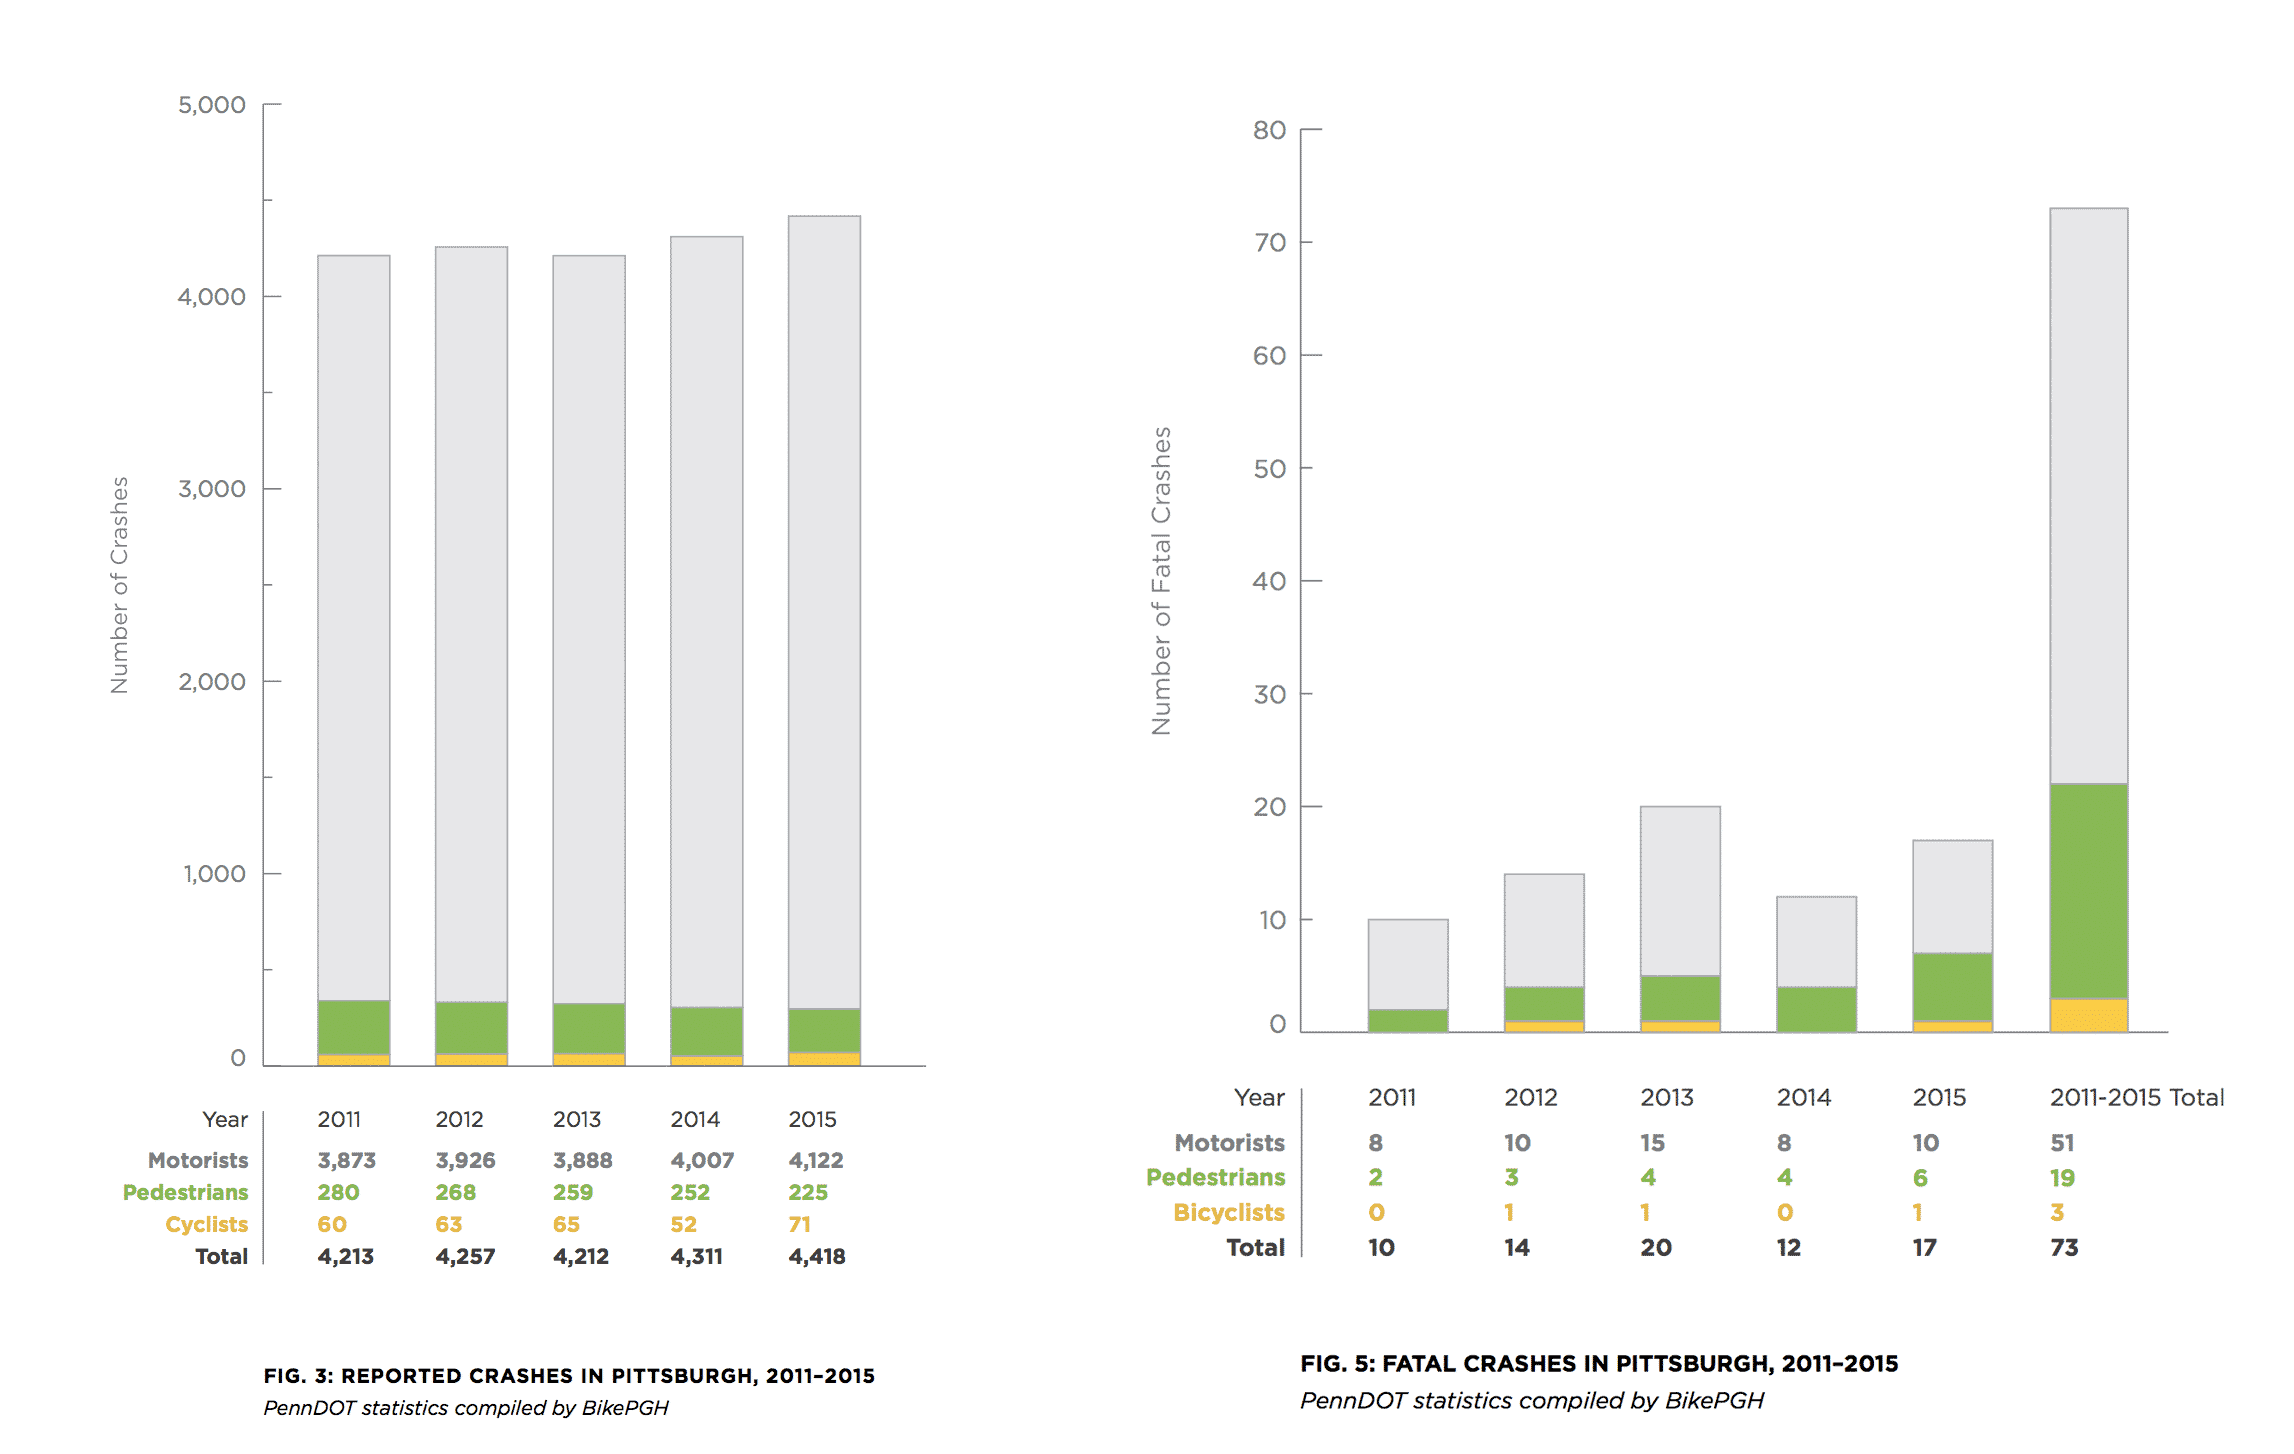
A pedestrian is hit every 34 hours in Pittsburgh. A bicyclist is involved in a crash every 6 days.
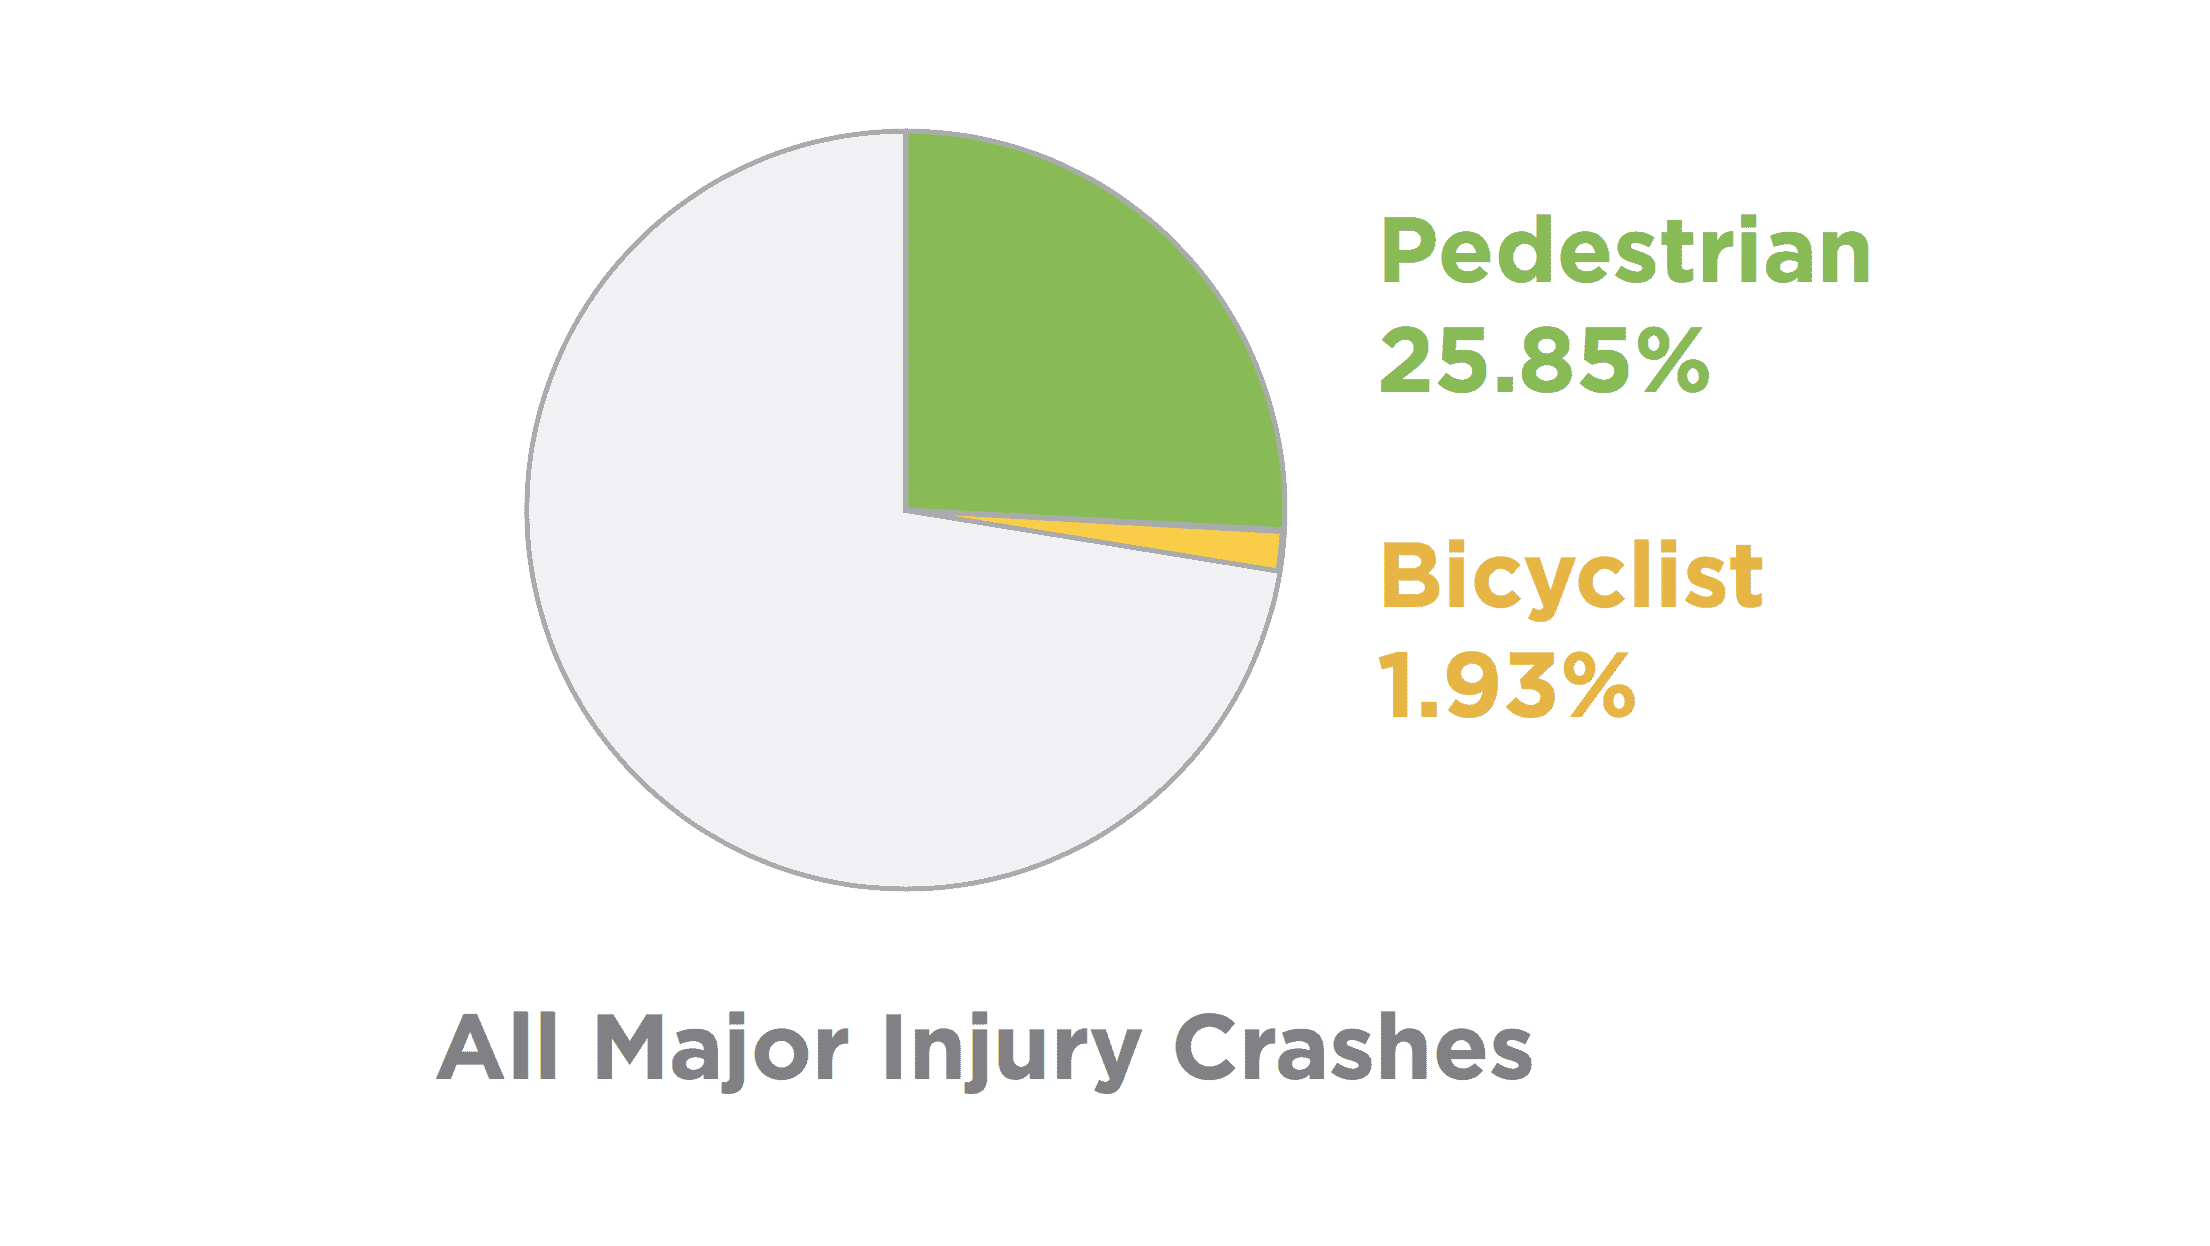
On average, between 2011 and 2015, an average of 69 crashes per year left someone with a major injury, 28% of which are bicyclists and pedestrians.
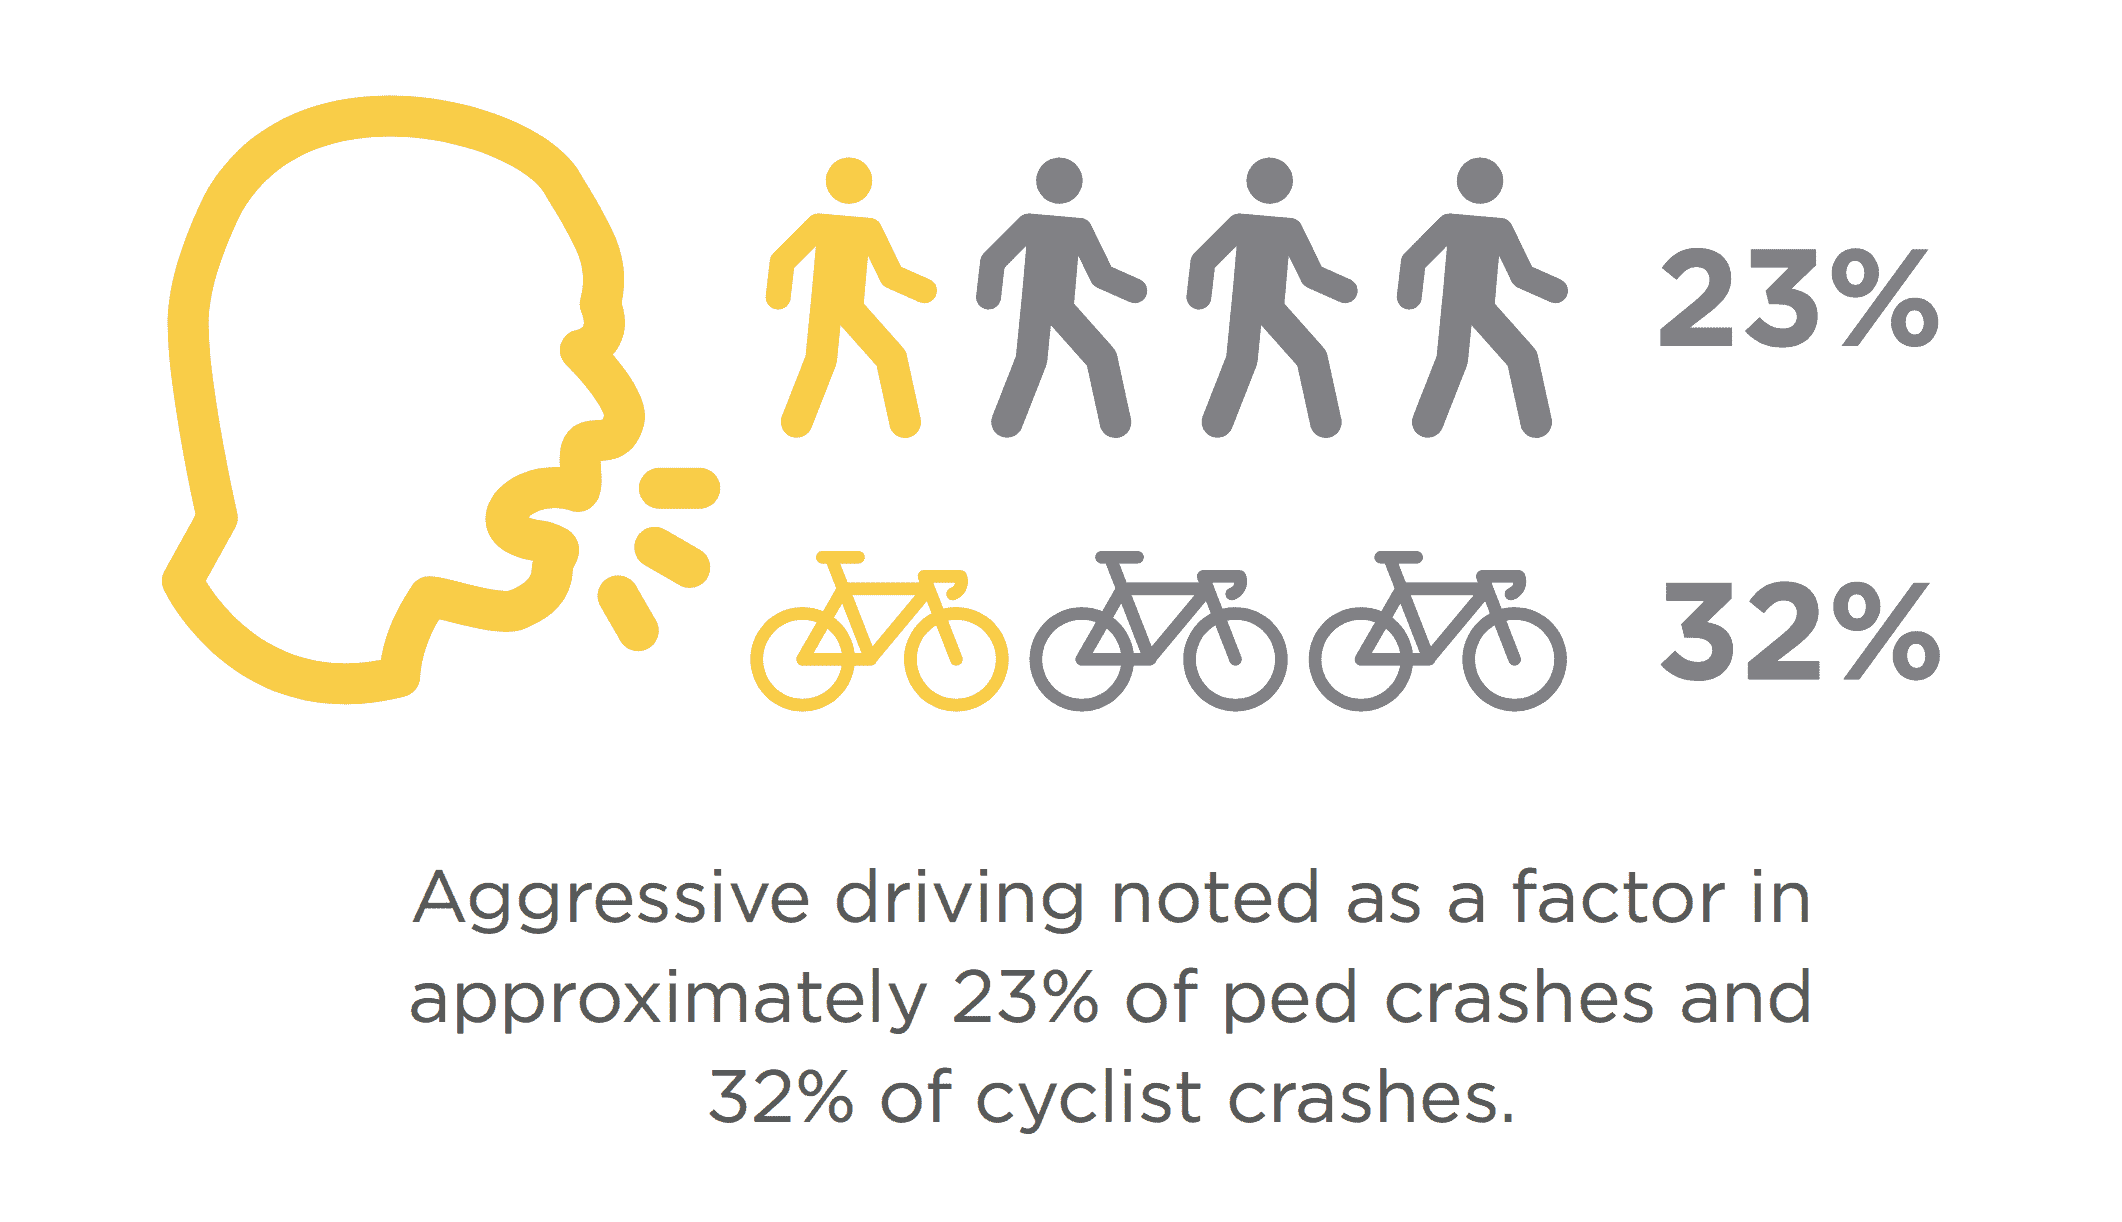
The data shows that conditions leading to the majority of pedestrian and bicyclist crashes are not caused by pedestrians or bicyclists.
Better crosswalks, protected bike lanes, and reducing automobile travel speeds will go a long way in reducing the burden of injury for Pittsburgh’s cyclists and pedestrians, the most vulnerable users on our roadways.
DOWNLOAD THE FULL REPORT HERE
If there’s one big takeaway from this report is that we need to put pedestrians first when it comes to street safety. All trips begin and end as a pedestrian.
By targeting investment and safety improvements towards the approximately 300 pedestrian and bicycle crashes that occur each year, major injuries and traffic fatalities can be significantly reduced, if not eliminated.