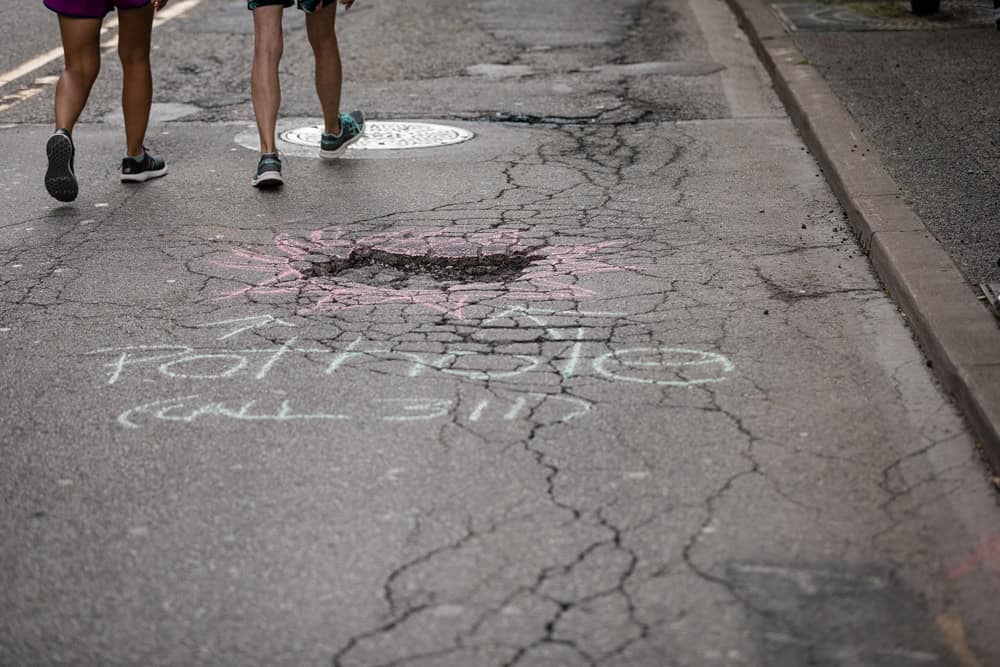
Patterns reveal trouble spots along popular routes
As previously explored, the Make My Trip Count survey data has given us an interesting glimpse into Pittsburgh’s biking and walking; where people bike and why, what kind of growth we’ve seen, and what can impact that growth in the future.
Another way to explore these patterns is using the City of Pittsburgh’s publicly available 311 data.
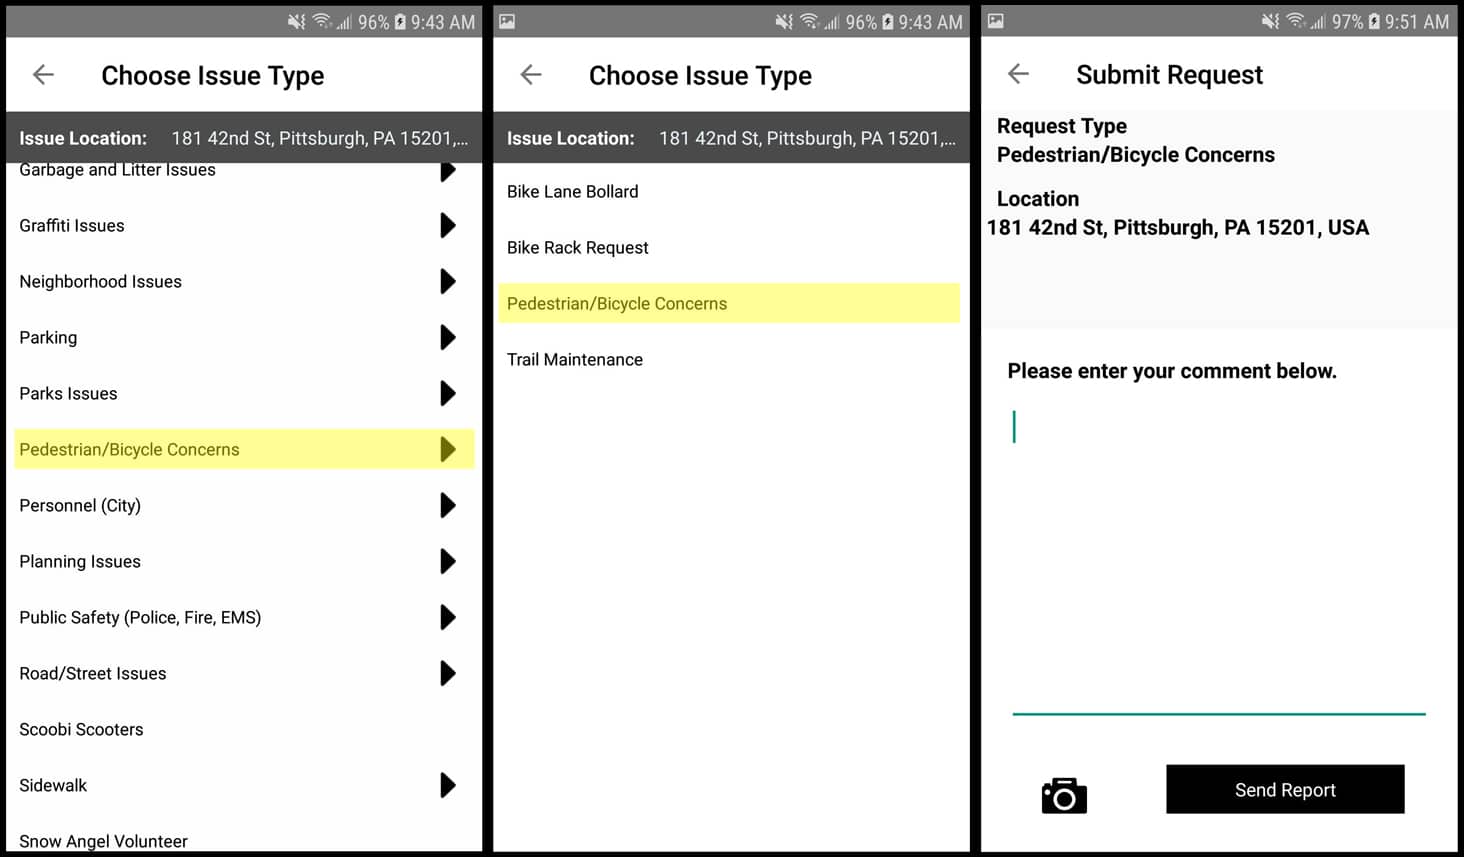
How to submit complaints with 311
The City of Pittsburgh’s 311 service is a hotline that allows residents to submit complaints to the city on any number of issues, from potholes, to animal waste to water main breaks. Citizens can use the phone number, online portal, MyBurgh App (highly recommended), and even Twitter to air their grievances to the city. It’s an effective tool used by citizens and advocates to help improve issues both minor and major.
People on bike and on foot are given a specific place for issues pertaining to them. The broad category of “Pedestrian/Bicycle Concerns” includes options to submit information on bike lane bollards and trail maintenance, request a bike rack, or submit general concerns.
Within pedestrian and bicycle complaints, unfortunately there’s a lack of specificity in the publicly available data. “Pedestrian and bicycle concerns,” the most commonly selected option, is a broad category that could encompass anything from a dangerous crosswalk, to debris, to noting a location where cars regularly park in a bike lane or sidewalk.
Interactive map of Pittsburgh 311 Requests, “Pedestrian and Bicycle Concerns” Feb 20, 2015 through July 10, 2019
311 requests provide an interesting way to look at pedestrian and bike movements throughout the city. While the service is designed for users to submit complaints or service requests for an area, it follows that higher trafficked routes would have higher numbers of 311 requests where, after enough submissions, patterns emerge. Requests along the Penn Avenue protected bike lane, for example, account for over 50% of all bike and pedestrian requests submitted in Downtown.
75% all of the 311 bike and pedestrian complaints between February 2, 2015 and July 10, 2019 fall along BikePGH’s Bike Map (both infrastructure, like bike lanes and sharrows, and networks such as recommended routes and trails).
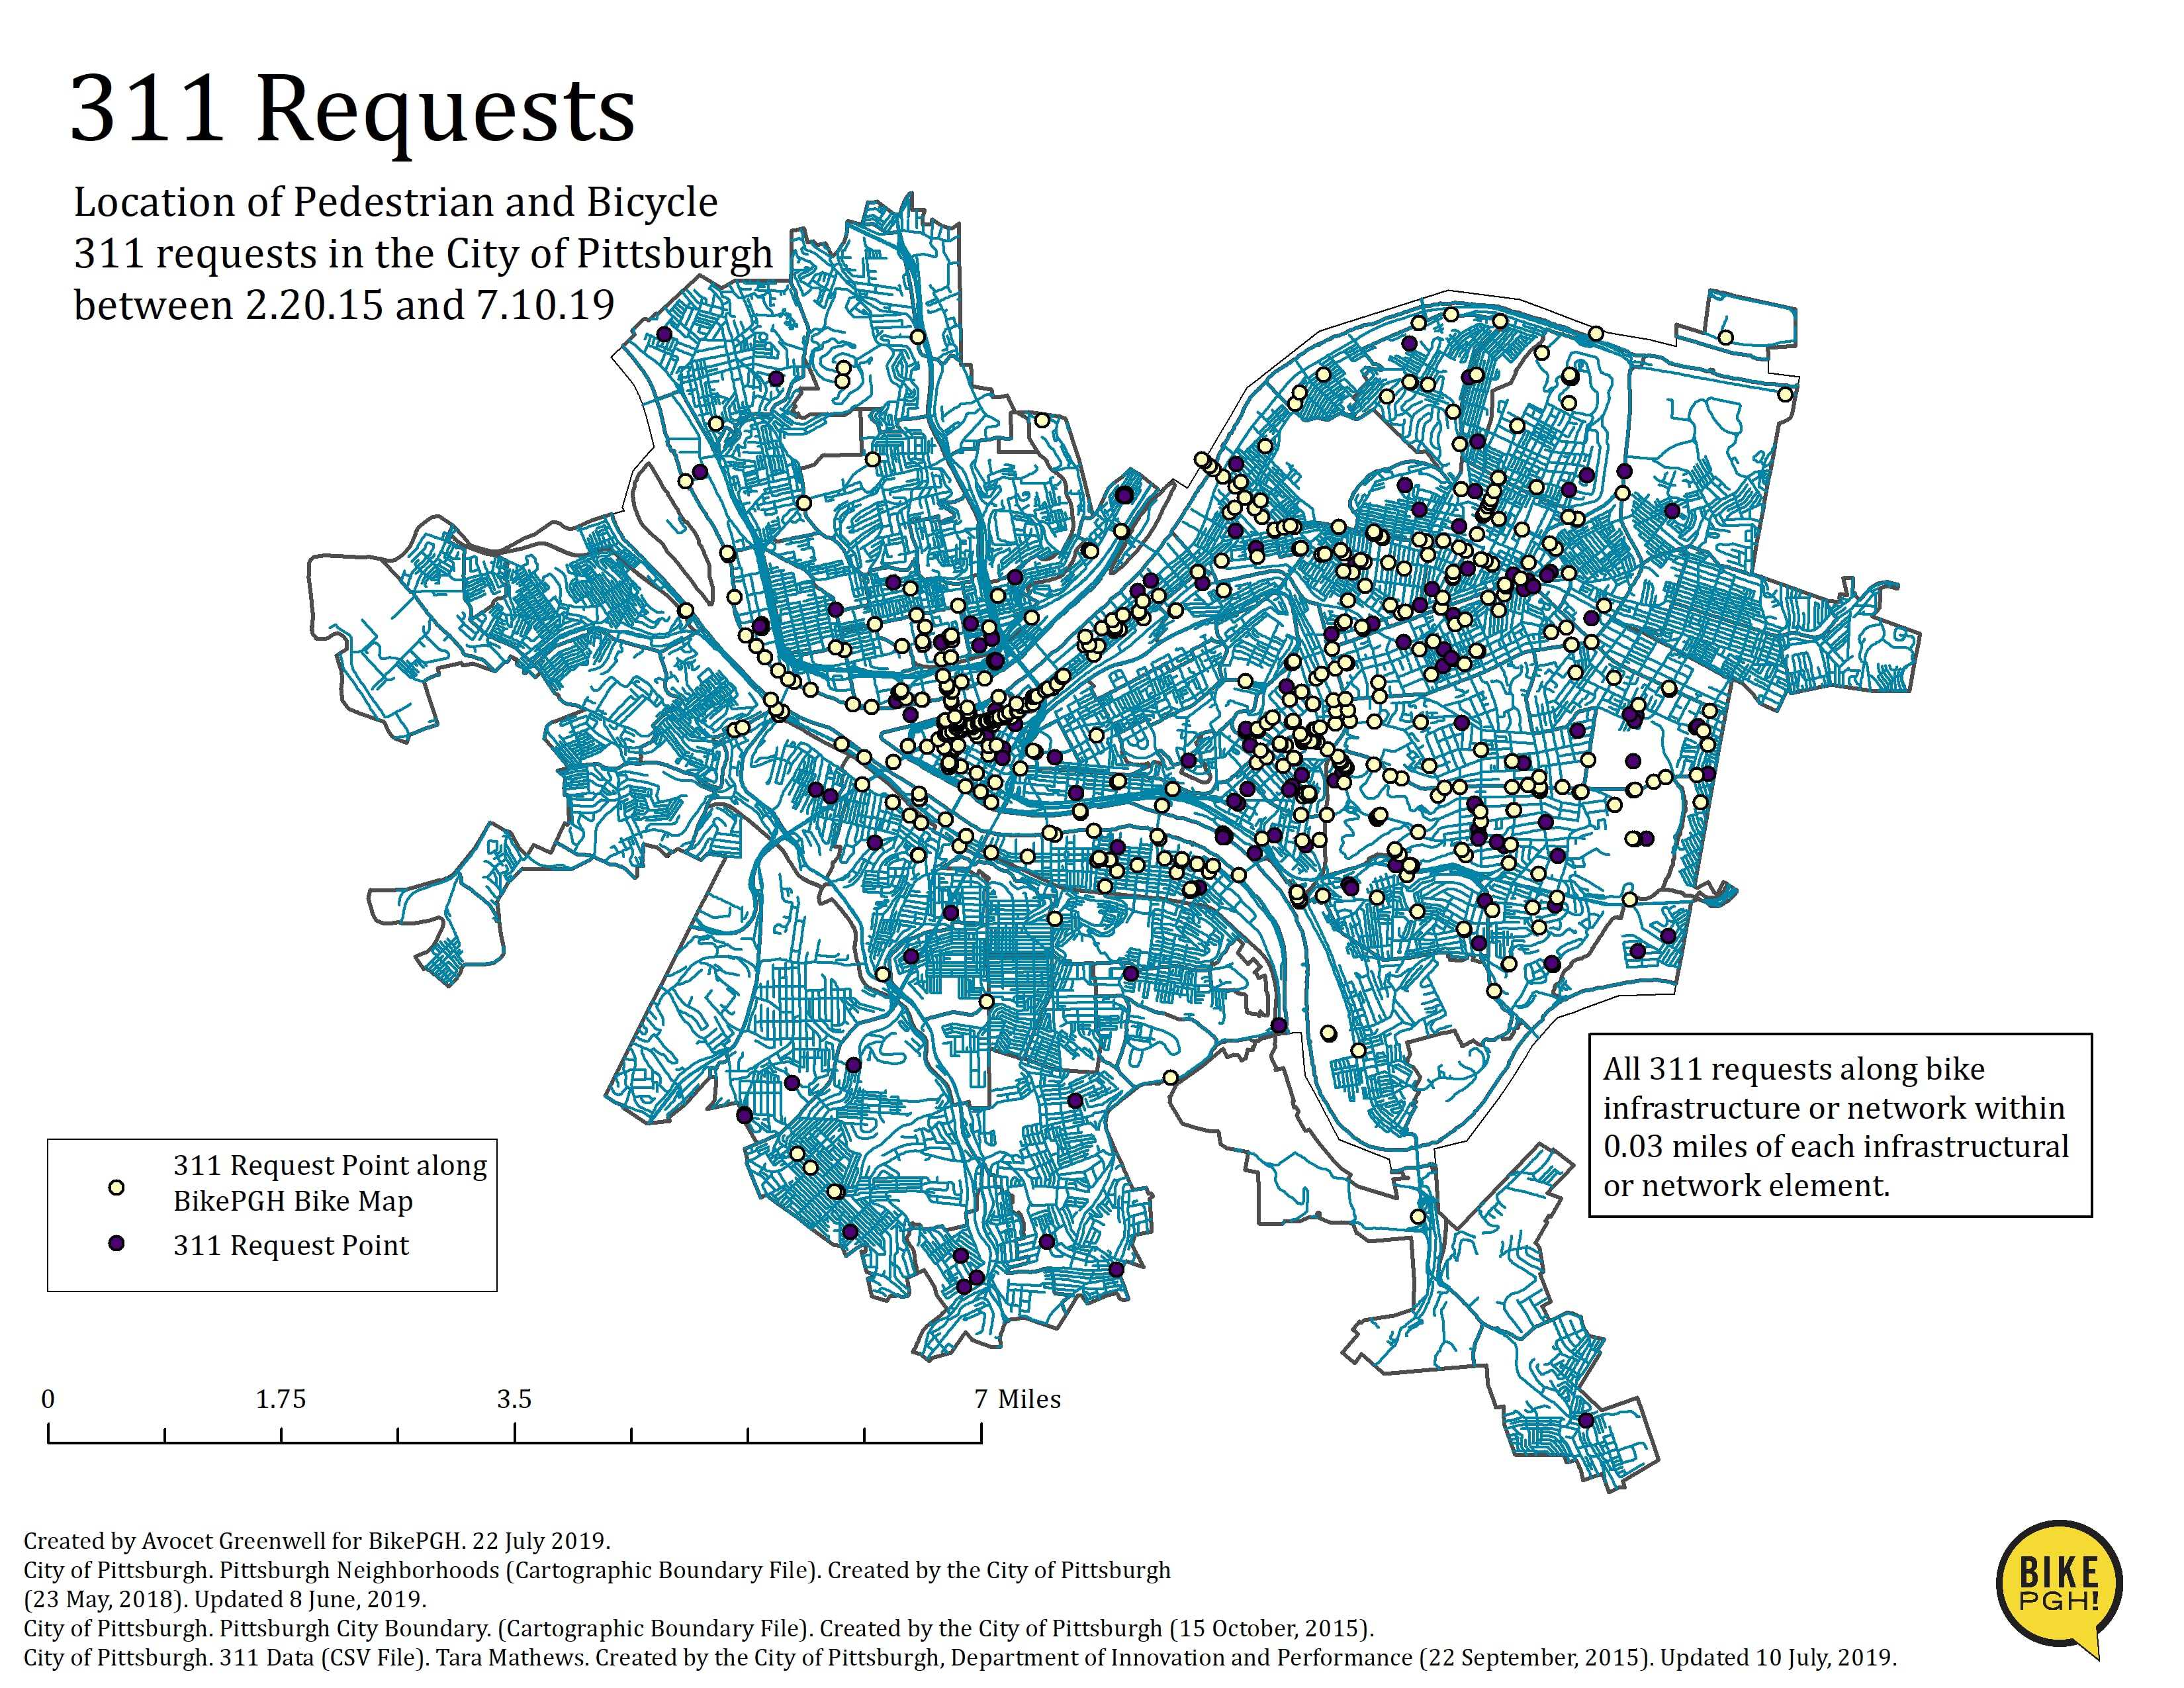
Contrasted with the Bike Map, the 311 request points also provide an insight into network and infrastructural gaps, and areas for improvement
Penn Avenue between 40th Street and Shady Avenue connects Bloomfield, Garfield, Central Lawrenceville, and East Liberty – neighborhoods with significant cycling populations. The flat, two-mile stretch is devoid of any bike infrastructure; a cautionary bike route exists until Highland Avenue, and Google Maps outdoes itself in contorting a recommended cycling route avoiding Penn Avenue. But the smattering of 311 requests lining the route point to any number of complaints and desired improvements in connectivity for non-motorized users of Penn.

311 doesn’t always paint a complete picture
Like the MMTC survey, the data is only as comprehensive as the number of individuals that file complaints. The 311 portal isn’t the most user friendly; with over 200 complaint types, it can be difficult to find the right one that will help the complaint reach the correct department in the City. Furthermore, many people don’t even know that 311 exists.
In spite of its limitations, 311 remains an important resource in identifying problem spots for pedestrians and bicyclists. Even without specifics, the proliferation of 311 requests along a route points to desired street improvements of non-motorized road users.