Large reductions of all crash types shown over 104 month analysis
Few things seem to blow up the Post-Gazette comments section like an article about bike lanes. The Penn Ave bike lanes Downtown seem to especially stir passions. Even though the bike lanes are now six years old, those who are against them still resent the fact that they used to be able to drive both ways on Penn, and are particularly irked that this space was given over to “undeserving” bicyclists, who apparently don’t need to pay taxes.
Those who support the bike lanes point to the minor inconvenience to drivers, while bringing major safety benefits and a reduction of bottlenecks at a number of intersections (especially at the 16th St Bridge). One side has been pushing for the expansion of the bike lanes into the eastern neighborhoods, as originally promised, while the other side wants to see Penn Ave go back the way it was six years ago.

Such a passionate debate sheds a light on people’s perception of reality, with people claiming that both “no one uses the bike lanes” and that they are dangerous, while others claim that “the bike lanes are packed” and things are safer. Both realities cannot be true.
Lucky for us, the Penn Ave bike lanes are the most studied bike lanes in Pittsburgh, having four years of data from counters placed at three locations, as well as a large sample size of a crash history both before and after their installation.
So we thought we’d break down some of these arguments and show the existing data to see how this one-mile stretch of the Penn Ave bike lanes have affected road safety, all the while encouraging people to not bring their cars into our dense downtown.
“The bike lanes are dangerous” vs “The bike lanes are safe” argument
Every change in a street requires tradeoffs. An increase in safety may often require a decrease in speed and convenience for drivers. However, the goal is to have an overall net positive effect on roadway safety, while minimizing inconvenience, and the Penn Ave bike lane clearly fits the bill. One misconception of bike lanes is that they only help bicyclists. But data and experience show that these bike lanes have helped both pedestrians and drivers alike.
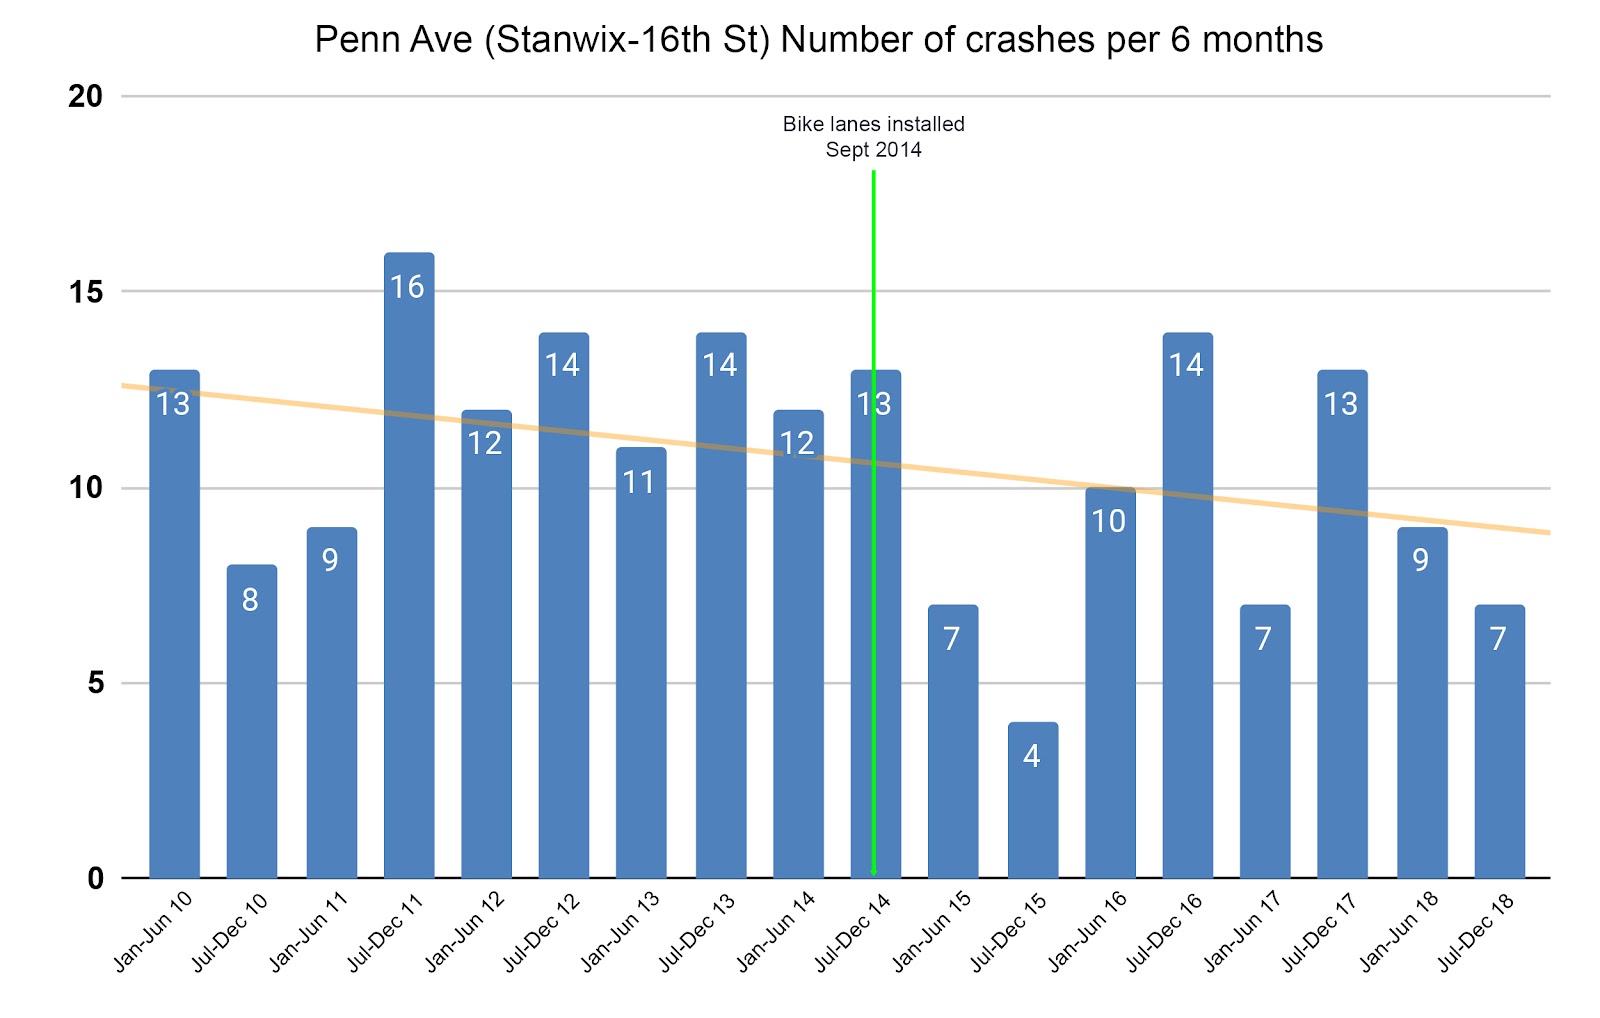
We took a deep dive into the available crash data for the 52 months before and the 52 months after the bike lanes were installed. Records between May 2010 and December 2018 were picked because this was the maximum amount of available data, while keeping it an equal number of months before and after the September 2014 installation. The results are eye-opening.
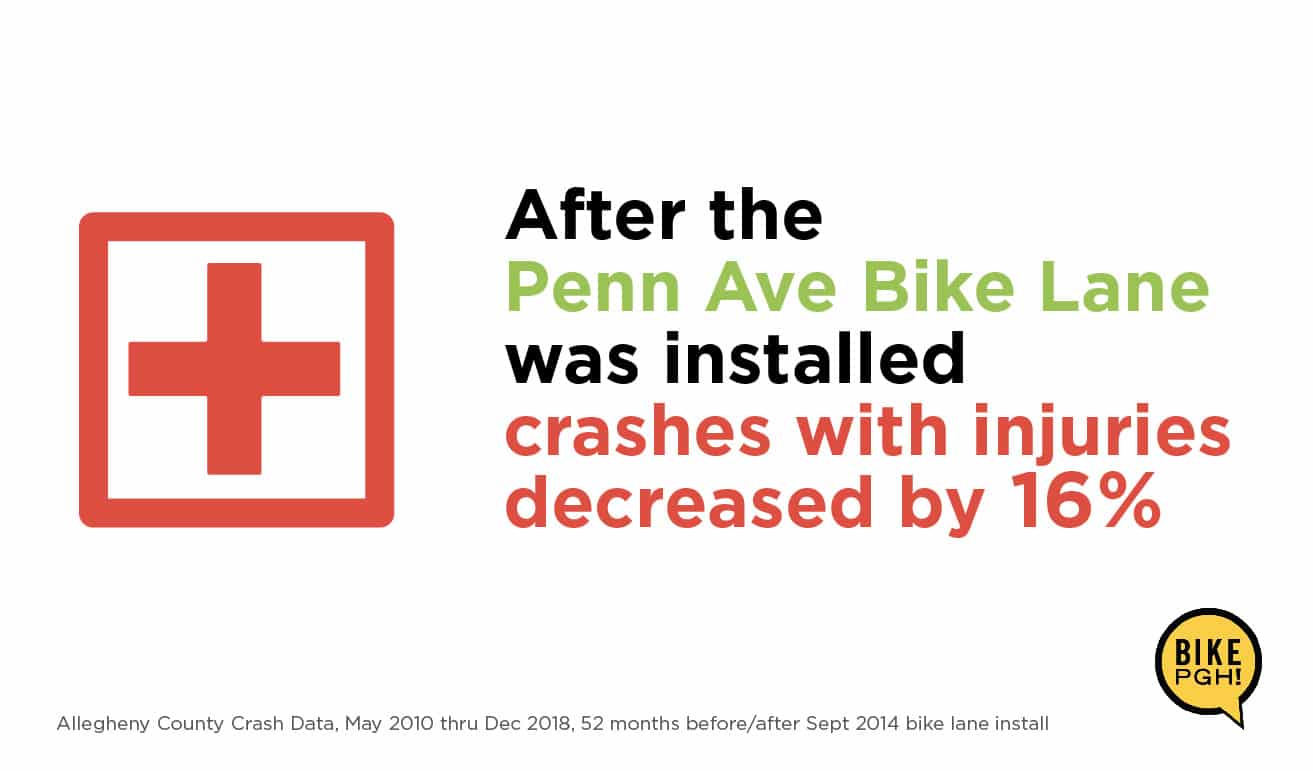
First and foremost, the total crashes of all types, went from 107 in the 52 months before the installation to 79 in the 52 months afterwards, a decrease of 28 crashes, or 26%. In fact, pre-bike lane, there were only 5 months without a crash, while after, the number of months without a crash doubled to 10. Further, crashes that involved an injury also dropped from 50 to 42, or 16%.
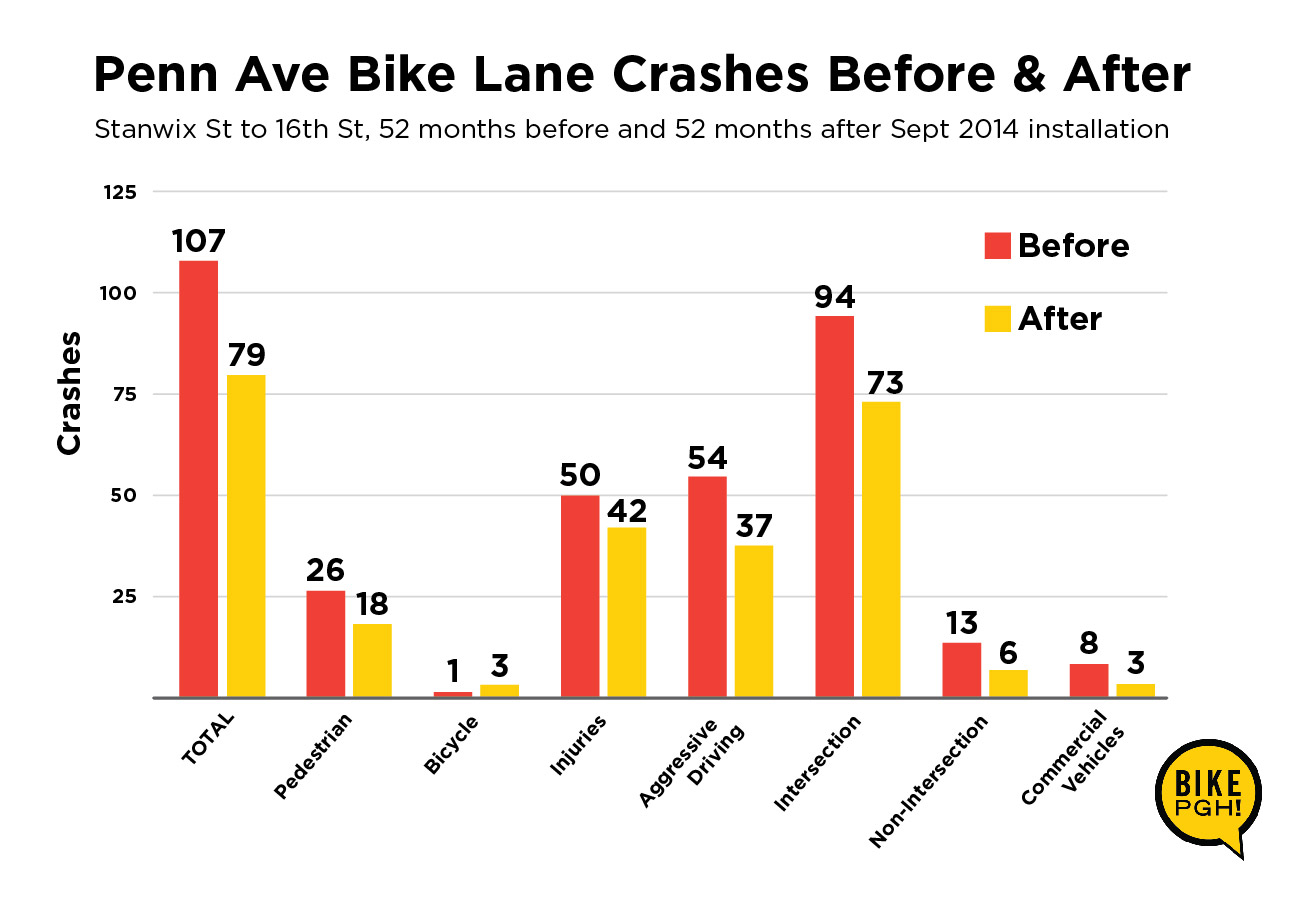
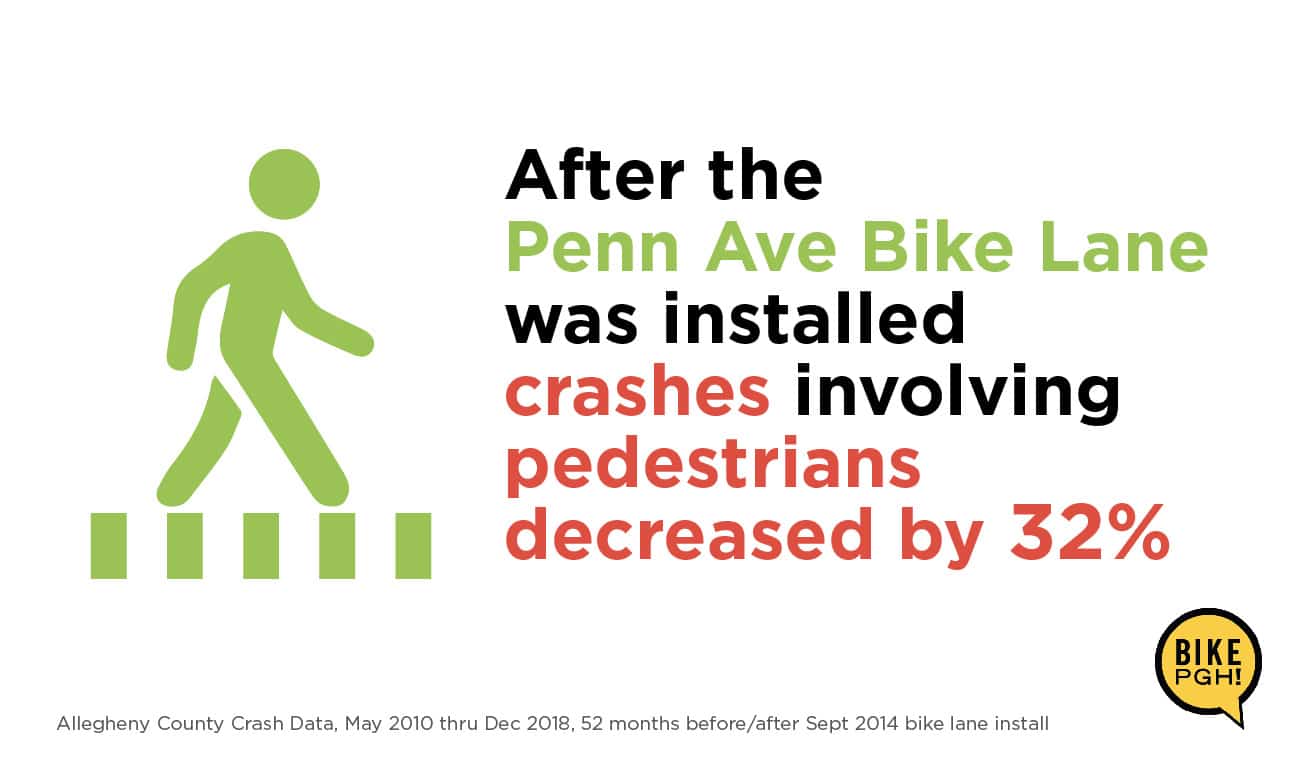
Taking a deeper dive into the numbers, other patterns emerge. Most importantly, the number of crashes involving pedestrians (in the same time periods) dropped 32%, from 25 to 17. While great to see, this isn’t a total surprise as pedestrians now only need to worry about cars from a single direction. In fact, before the bike lanes went in, officers used to be stationed at key intersections during rush hours, simply to help pedestrians cross the street. Needless to say, after the bike lanes went in, the officers were freed up to work on other aspects of their job, saving additional city revenue.
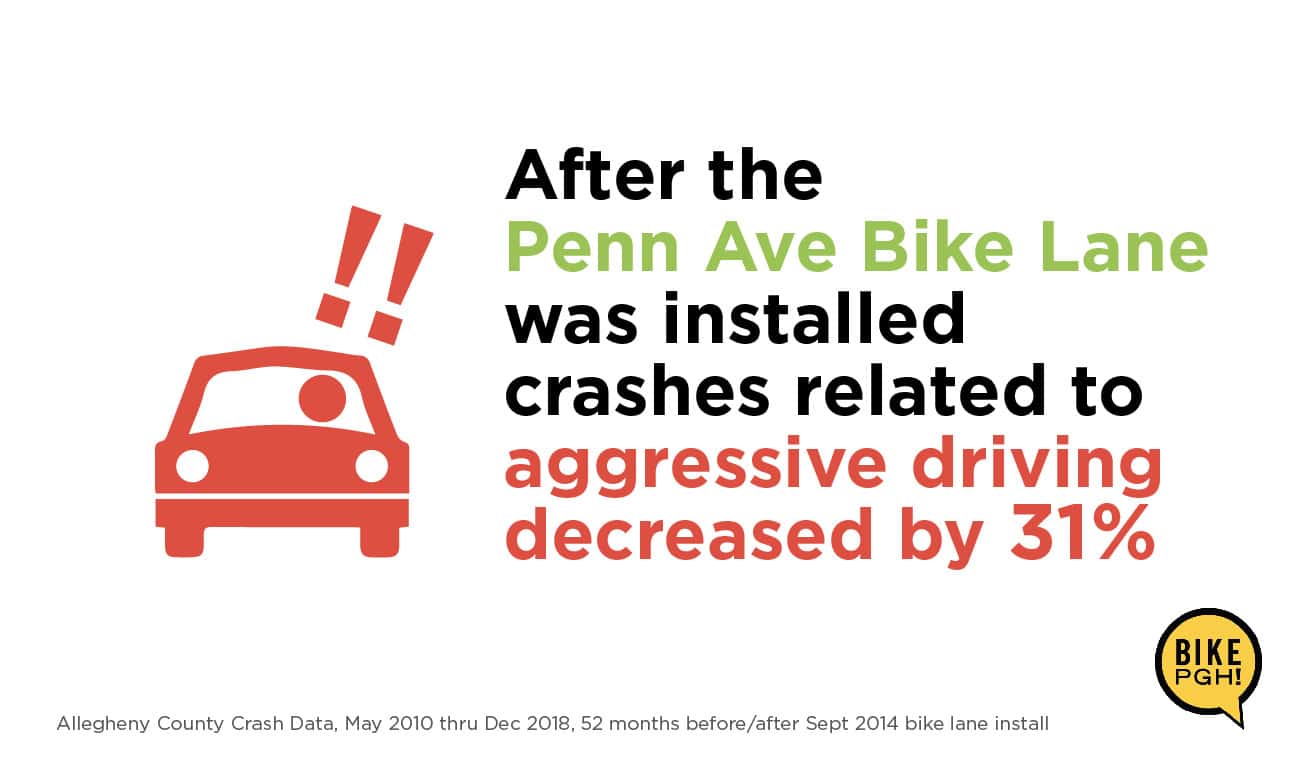
Further, before the bike lanes, police marked 54 crashes related to aggressive driving, while after, they tagged 37 to this cause, a decrease of 31%.
Intersection and non-intersection related crashes also dropped. Intersection related crashes were tagged in 94 of the pre-bike lane crashes and 73 after (22% drop), while non-intersection crashes went from 13 to 6 (54% drop). Additionally, crashes involving commercial vehicles went from 8 to 3, despite a boom in businesses along Penn Ave.
Finally, reported crashes involving a bicycle did increase from 1 to 3 (all resulting in an injury), but the number of people on bicycles within the corridor have increased significantly, which brings us to the next section.
“Nobody uses the bike lanes” vs “The bike lanes are packed” argument
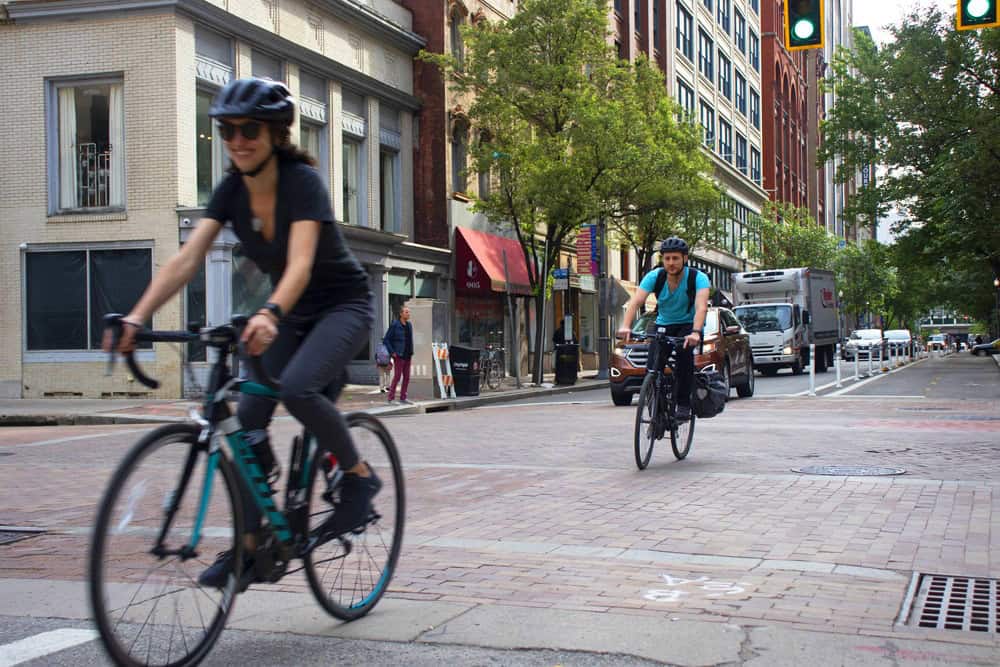
To people who use the bike lanes, this is one of the more baffling comments. Personal experience says that you usually cross paths with several people on bikes in the short stretch of bike lane, even when the weather is less than ideal. Fortunately, since 2016, there have been counters in the bike lane in three locations: 12th St, 9th St and 6th St. For instance, on average, there are more than 400 daily trips recorded at 12th St, with a peak of 3,700 in one day alone.
Additionally, each Bike To Work Day, we’ve been counting the percent of traffic on Penn Ave during the morning rush hour commute, consistently counting one bike for every three cars year after year. Drivers should be applauding this effort, as each bicyclist represents one less occupied parking space or seat on the bus.
“The bike lanes are expensive” vs “The bike lanes are cost effective” argument
Whether you ride a bike, walk, take the bus, or drive a car, it’s clear that the bike lanes have helped everybody move through the corridor more safely and predictably. The cost to people who are hit by cars due to lost work, hospital visits, and lifelong disabilities and trauma is immense. In Pennsylvania, these costs add up to $5.8B, or $461 per resident, according to the National Highway Transportation Safety Administration.
There are actual costs to the city for each crash as well. It costs money to send a first responder, to have police write a report, repair to City property, street closures, cleanup, etc. Each crash that is avoided saves the City a lot of money.
On an individual level, a crash resulting in an injury will cost a person on average between $22K and $27K, depending on severity of the injury and damage to the vehicle.
With these factors added up, it’s quite remarkable that the ~$100K that the City spent on paint, engineering, construction, and flex posts (some acquired from a grant) could result in such a marked drop in crashes and injuries, and the savings associated with it. No doubt there are other factors associated with this dramatic change, but ultimately the biggest factor is likely the one that so clearly changed how people use and relate to the street: The Penn Ave bike lanes.
So, back to the question at hand: Is the small inconvenience to drivers worth it?
It’s clear the Penn Ave bike lanes are a pretty big bang for the buck, and we’ll continue to push for these benefits for Pittsburghers to enjoy citywide.